The tests were run only on 64-bit systems.
Switches
The following switch was used:Network
Note that neither the network nor the test machines were reserved exclusively for the performance tests, so some ofthe fluctuations are explained by the fact that other users/processes were using the machines and/or generating traffic on
the network. This was mitigated somewhat by running all tests in the AM hours (8am - 3pm) in Europe, when the servers in
Atlanta GA were mostly idle. We also use machines which have no cron jobs (like cruisecontrol etc) scheduled that could interfere
with the tests.
JVM configuration
The following JVM was used:SUN: JDK 1.5.0_04-b05 Java HotSpot(TM) Server VM (build 1.5.0_04-b05, mixed mode)
The options used for starting the JVMs were:
SUN: -Xmx500M -Xms500M -XX:CompileThreshold=1000 -XX:+UseParallelGC -XX:+AggressiveHeap -XX:NewRatio=1 -server -Dlog4j.configuration=file:/home/bela/log4j.properties -Dresolve.dns=false -Dbind.address=${MYTESTIP_1}
Design of the tests
The goal of the test is to measure the time it takes to reliably send N messages to all nodes in a cluster. We are currently not interested in measuring the latency of remote group RPC, this may be done in a future performance test. The test works as follows.- All members have access to 2 configuration files: one for defining the number of messages to be sent, the number of cluster members, senders etc, and the other one defining the JGroups protocol stack.
- N processes are started. They can be started on the same machine,
but for better results there is one JGroups process / box. In the
performance test, we started each member on a different node in the
cluster.
- The processes join the same group, and when N equals the cluster size defined in the configuration file, all senders start sending M messages to the cluster (M is also defined in the configuration file).
- Every node in the cluster receives the messages (senders are also receivers). When the first message is received the clock is started. When the last message is received the clock is stopped. Every member knows how many messages are to be received: <number of senders> * <number of messages>. This allows every receiver to compute the message rate and throughput (we also know the size of each message).
The configuration file (config.txt) is shown below (only the JGroups configuration is shown):
# Class implementing the org.jgroups.tests.perf.Transport interface


transport=org.jgroups.tests.perf.transports.JGroupsTransport

#transport=org.jgroups.tests.perf.transports.UdpTransport

#transport=org.jgroups.tests.perf.transports.TcpTransport


# Number of messages a sender multicasts

num_msgs=1000000


# Message size in bytes.

msg_size=1000


# Expected number of group members.

num_members=2


# Number of senders in the group. Min 1, max num_members.

num_senders=2


# dump stats every n msgs

log_interval=100000
This file must be the same for all nodes, so it is suggested to place it in a shared file system, e.g. an NFS mounted directory.
The following parameters are used:
| transport |
An implementation of Transport,
for our tests we used the JGroupsTransport |
| num_msgs |
Number of messages to be sent by
a sender |
| msg_size |
Number of bytes of a single
message |
| num_members |
Number of members. When members
are started, they wait until num_members nodes have joined the cluster,
and then the senders start sending messages |
| num_senders |
Number of senders (must be less
then or equal to num_members). This allows each receiver to compute the
total number of messages to be received: num_senders * num_msgs. In the
example, we'll receive 2000000 messages (2 * 1M messages) |
| log_interval |
Output about sent and received
messages will be output to stdout (and to file if -f is used (see
below)) every log_interval messages |
The options for the test driver are:
bela@laptop /cygdrive/c
$ java org.jgroups.tests.perf.Test -help
Test [-help] ([-sender] | [-receiver]) [-config <config file>] [-props <stack config>] [-verbose] [-jmx] [-dump_stats] [-f <filename>]
| -sender / -
receiver |
Whether this process is a sender
or a receiver (a sender is always a receiver as well) |
| -config
<file> |
Points to the configuration
file, e.g. -config /home/bela/config.txt |
| -props
<props> |
The JGroups protocol stack
configuration. Example: -props c:\fc-fast-minimalthreads.xml. Can be
any URL or filename |
| -verbose |
Verbose output |
| -jmx |
Enables JMX instrumentation
(requires JVM with JMX MBeanServer, e.g. JDK5). This will cause the VM
not to terminate when done. To access the process via JMX, the
-Dcom.sun.management.jmxremote property has to be defined and jconsole
can be used. For more details see http://wiki.jboss.org/wiki/Wiki.jsp?page=JMX. |
| -dump_stats |
Dumps some JMX statistics after
the run, e.g. number of messages sent, number of times blocked etc |
| -f
<filename> |
Dumps number of messages sent,
message rate, throughput, current time, free and total memory to
<filename> every log_interval milliseonds. This is the main tool
to generate charts on memory behavior or message rate variance |
| -help |
This help |
The files needed to run te tests are included with JGroups (source distribution) as well: JGroups/conf/config.txt is the configuration file, and JGroups/conf/fc-fast-minimalthreads.xml is the stack. However, note that all the test runs will have the JGroups stack configuration file included so that they can be reproduced.
For additional details on how to run the tests refer to http://wiki.jboss.org/wiki/Wiki.jsp?page=PerfTests.
Parameters
The parameters that are varied are:- Cluster size: 4, 6 (only with UDP) and 8
- Number of senders: 1, N/2 and N (where N is the cluster size)
- Number of messages: this is computed according to the input
parameters of http://wiki.jboss.org/wiki/Wiki.jsp?page=AutomatedPerfTests.
The goal is to have approximately the same number of bytes sent for
each test. So, if we want to send 1M messages and have 8 senders, each
sender will send 125K messages. If we only have 1 sender, that sender
will send 1M messages.
- Message size: 1K, 2.5K and 5K
- Switch: 1Gbps switch (see above)
- Protocols: IP multicast-based transport
(fc-fast-minimalthreads.xml) and TCP-based transport (tcp-nio.xml)
- JVMs: SUN JDK5 (see above)
- JGroups: 2.4
Results
The plain results are available here for the 4 node cluster, here for the 6 node cluster and here for the 8 node cluster. The OpenOffice spreadsheet containing all results can be obtained here.The performance tests were run on the 3 clusters, measuring message rate (messages received/sec) and throughput (MB received/sec), as described in http://wiki.jboss.org/wiki/Wiki.jsp?page=PerfTests.
The JGroups configurations used are:
- UDP (fc-fast-minimalthreads.xml):
uses IP multicast in the transport, with flow control
- TCP (tcp-nio.xml): uses multiple NIO-based TCP connections in the transport
Message rate and throughput
The Y axes define message rate and throughput. The message rate is computed as <number of messages sent> * <number of senders> / <time to receive all messages>. For example, a message rate of 35000 for 1K means that a receiver received 35000 1K messages on average per second. On average means that - at the end of a test run - all nodes post their results, which are collected, summed up and divided by the number of nodes. So if we have 2 nodes, and they post message rates of 10000 and 20000, the average messsage rate will be 15000.The throughput is simply the average message rate times the message size.
4 node cluster
 |
 |
 |
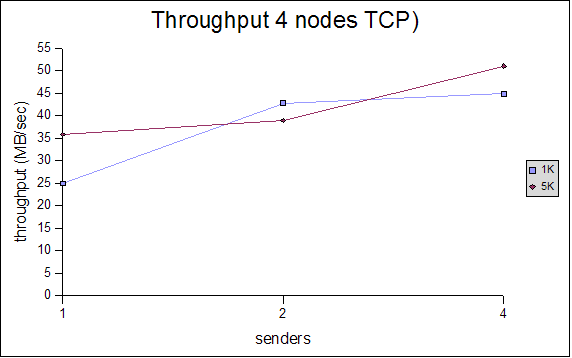 |
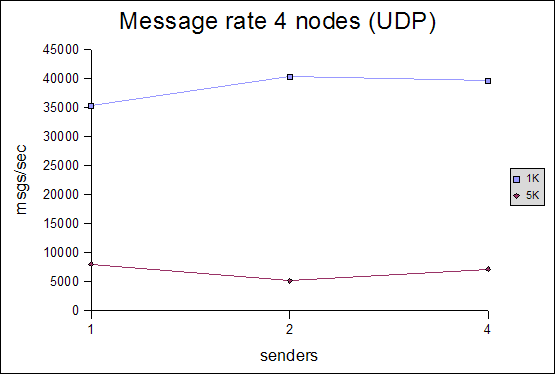
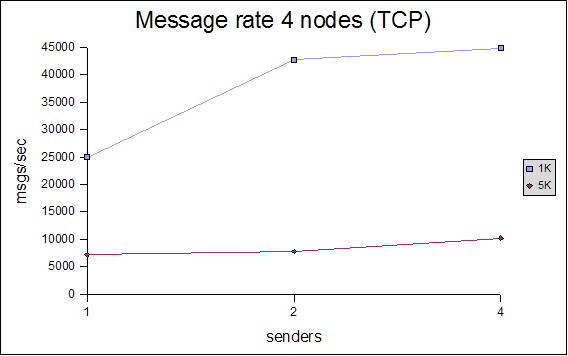
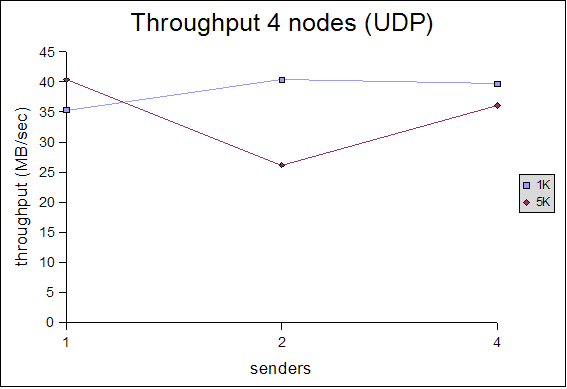
For the 4 node cluster, we only measured 1K and 5K messages. The message rate for UDP (using IP multicasting) is relatively stable for 1, 2 and 4 senders. In the TCP case, we can see that the message rate for 1 sender for 1K messages is slightly lower, then catches up for larger messages and more senders. In both cases, the message rate for 5K messages is lower than that for 1K, but the aggregate throughput is s about the same.
We get an average message rate of between 35000 and 40000 1K messages and 5000-8000 5K messages for UDP, and between 25000 and 45000 1K messages and 7000-10000 5K messages for TCP.
6 node cluster

 for a 6 node UDP cluster")
For lack of availability of the entire cluster, we could only measure UDP with the 6 node cluster. The numbers shown above are somewhat contradictory to the rest of the tests: they show that the message rate and throughput decreases with increasing cluster size. The absolute numbers are also worse than for the 4-node and 8-node cluster ! A possible explanation is that since 2 machines were not available to us, these 2 machines might have generated network traffic, negatively affecting our tests.
8 node cluster
 |
 |
 |
 |
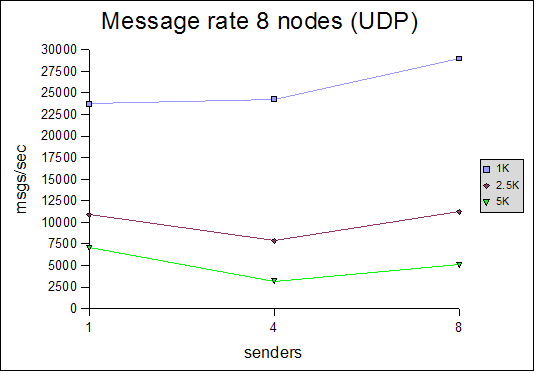
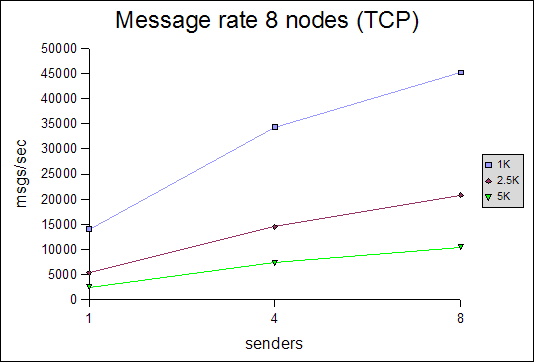
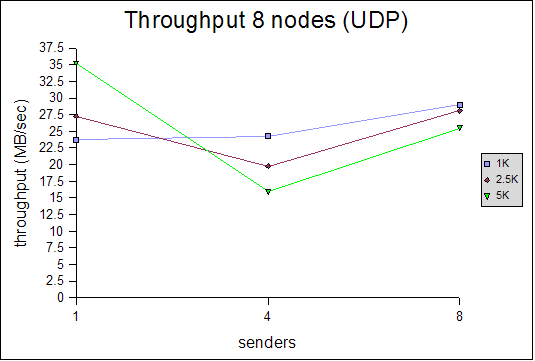
The 8 node UDP cluster exhibits similar characteristics as the 4 node cluster: for 1 sender, the results are good, then they go down slightly for 4 senders, and go up again for 8 senders. With TCP, this is different: the numbers for 1 sender are lower than for UDP, but go up for 4 and 8 senders and pass UDP at 4 senders.
With UDP, the messages rates for 1, 4 and 8 senders (sending 1K messages) don't vary much (23732, 24270 and 28994 messages/sec). The same goes for 2.5K messages. However, there is bigger variation for 5K messages.
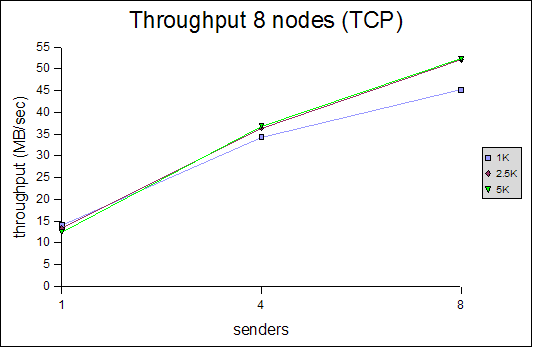
For TCP throughput, 1 sender sends messages at around 14MB/sec, 4 senders climb to 36MB/sec and 8 senders to 50MB/sec, regardless of the message size.
Interpretation of results
General
All of the tests were conducted with a relatively conservative configuration, which would allow for the tests to be run for an extended period of time. For example, the number of credits in flow control was relatively small. Had we set them to a higher value, we would have probably gotten better results, but the tests would not have been able to run for an extended period of time without running out of memory. For instance, the number of credits should be a function of the group size (more credits for more nodes in the cluster), however, we used (more or less) the same configuration for all tests. We will introduce an enhanced version of the flow control protocol which dynamically adapts credits, e.g. based on free memory, loss rate etc, in http://jira.jboss.com/jira/browse/JGRP-2.Another issue is the use of a gigabit ethernet switch. As shown in previous tests (http://www.jgroups.org/javagroupsnew/docs/Perftest.html), JGroups does saturate a 100Mbps switch with clusters up to 8 nodes, with roughly 11-11.5MB/sec. However, for the GB switch, where we could receive a max of ca 125MB/sec, the results show that we are far from reaching that number. However, the numbers shown are probably more than good enough for most applications using JGroups, especially if traffic-reducing mechanisms such as field-based replication for HTTP sessions are used.
Some reasons might be (needs further investigation):
- We don't currently use jumbo frames, but rather the default MTU of 1500 for ethernet. Jumbo frames allow for large IP packets to be sent on the ethernet. If we have a UDP datagram of 20K to send, and we have an MTU of 1500 bytes, the IP layer needs to fragment the datagram into 14 IP packets, whereas if we had an MTU of 9000 bytes, it would have to send only 3 IP packets. So if only one IP packet is lost, because we have to retransmit the entire datagram, the IP layer would have to re-send 14 or 3 packets respetively. See also this discussion for ramifications regarding JGroups.
- With jumbo frames we might be able to essentially transmit more data at almost the same message rate, so throughput might increase throughput dramatically. Needs to be investigated though.
- Static flow control in JGroups: FC doesn't dynamically adjust the
number of credits based on the number of nodes in a cluster, but this
is defined statically in the config file. We suspect these settings are
okay for smaller clusters, but would need to be adjusted for larger
clusters. We plan to write a new flow control protocol in JGroups 2.6, which
is based on credits (like the existing one), but also takes into
account latency, message loss and number of retransmissions and free
memory.
- No OS/NIC optimizations: in RHEL (and other Linux distributions), buffer sizes (IP, network card) for incoming packets, and other parameters can be configured. For example, larger buffer sizes lead to less chance of losing packets because of full buffers.
- No switch optimization: we used the GB switch unchanged and
haven't yet investigated switch tuning. For example, if the switch
implements traffic prioritization (e.g. 802.1p), then IP
multicasts have low priority. Same goes for IGMP snooping:
when enabled, it slows the switch/router down because each single
multicast packet has to be examined for whether it is an IGMP packet,
or just a regular multicast packet. If disabled, the multicasts would
be copied to all ports, which doesn't matter in our test because all
ports have 1 multicast member connected.
- Logging: we log performance data to disk every N messages
(default=100000). During the tests we logged to an NFS mounted file
system, which incurs one RPC. It would have been better to log to a
local disk (e.g. /tmp), but we didn't want to change the tests half-way
through
Processing of messages and scalability
The test program currently doesn't do any processing at the receiver when a message is received. Instead, a message counter is increased and the size added to the total number of messages received so far. This is of course an ideal situation, and not realistic for normal use, where receivers might unmarshal the message's byte buffer into something meaningful (e.g. an HTTP session), and process it (e.g. updating an HTTP session). (The test by the way allows to take processing time at the receiver into account by setting the processing_delay value). As a matter of fact, we have found in other tests (JBossCache, JBoss HTTP session replication) that the majority of the time is spent in marshalling and (especially) unmarshalling (serialization) of application data, rather than in JGroups. Until and unless marshalling times are reduced, the performance of JGroups will not even matter much.What does matter, however, is that (for JGroups 2.4) if we do have some processing time at the receiver, then incoming requests - even from different senders - have to wait in a queue to be processed. So if a receiver R receives messages A.M1 (M1 from A), B.M10, B.M11, B.M12 and A.M2, then B.M{10-12} and A.M2 will have to wait until A.M1 has been processed. Then B.M10 will be processed and B.M{11-12} and A.M2 will have to wait, and so on.
This will be changed in JGroups 2.5 with the threadless stack, where JGroups can be configured to process messages from different senders concurrently. For example, in the above case, JGroups could be configured to process all messages from A and B in separate threads (say T1 and T2), so T1 would process A.M{1-2} and T2 would process B.M{10-12}. This would allow for concurrent processing of A.M1 and B.M10, which increases performance, compared to the single-queue case above.
We will investigate whether the threadless stack increases performance for the performance tests, where no processing is done at the receiver.
UDP versus TCP
As can be seen with the 4 and 8 node clusters, TCP has better performance than UDP when more than one sender is sending messages. Since both UDP (fc-fast-minimalthreads.xml) and TCP (tcp_nio.xml) use flow control (FC), the problem cannot be flow control. There are multiple issues that could contribute to this, some of them being (needs to be investigated more):- Switch related
- Switches are generally unfavorable of IP multicast traffic (the only other traffic which is treated worse is broadcast). We need to investigate whether the switch implements a traffic shaping like priority mechanism whereby packets of lesser priority are discarded on congestion. Note, however, that since the performance test should be the only application running in the cluster during the time slot allotted to the tests, this may not be an issue.
- Full/half duplex. We need to make sure that all ports run in full-duplex mode (verified). We also need to look into whether flow control is enabled on the switch. This sometimes negatively impacts flow control implemented on the protocol level, e.g. TCP, or the application level (JGroups).
- Todo: run the performance tests and compare the statistics on the switch before and after, e.g. number of packets dropped
- Todo: look into disabling IGMP snooping (which has some
overhead checking all IP multicast packets whether they're IGMP)
- More efficient retransmission in TCP. This is an assumption and
needs to be verified. We need to monitor the loss/retransmission rate
for our tests and measure retransmission time.
Fluctuation of results (reproduceability)
As there was no reservation for the cluster labs (this was done by sending around emails), it is possible that some other applications were sometimes using the lab, generating network traffic and using CPU cycles, and thus distorting the results. Although we used the lab (based in Atlanta, GA) early in the morning (9am-2pm UST, 3am-8am EST), there's still a chance that a cron job was started, or someone from a different time zone was using the lab. We usually verified that no other application was running before starting our tests (by using last, top, who, ps for example), but that doesn't prevent some other application from starting during our test runs.Conclusion and outlook
We showed that performance of JGroups is good for clusters ranging from 4 to 8 nodes. TCP scales better than UDP, however it also creates a mesh of connections (every sender needs to be connected to everyone else in the cluster), which may not scale to large clusters.We intend to measure the performance of larger clusters (16 - 64 nodes) in the next round of benchmarks.